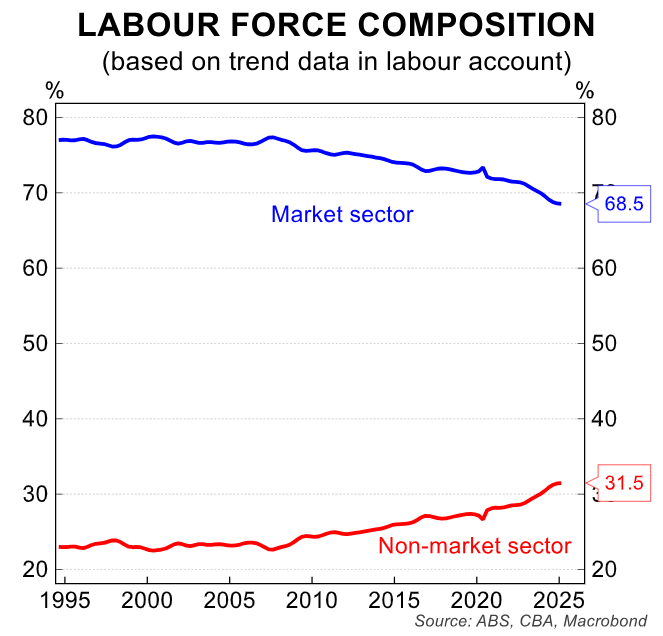
The boom in government-funded, non-market sector jobs, defined as jobs in the public service, healthcare & social assistance, and education, is well documented.
The non-market sector comprises only 31.5% of total Australian jobs, according to CBA:
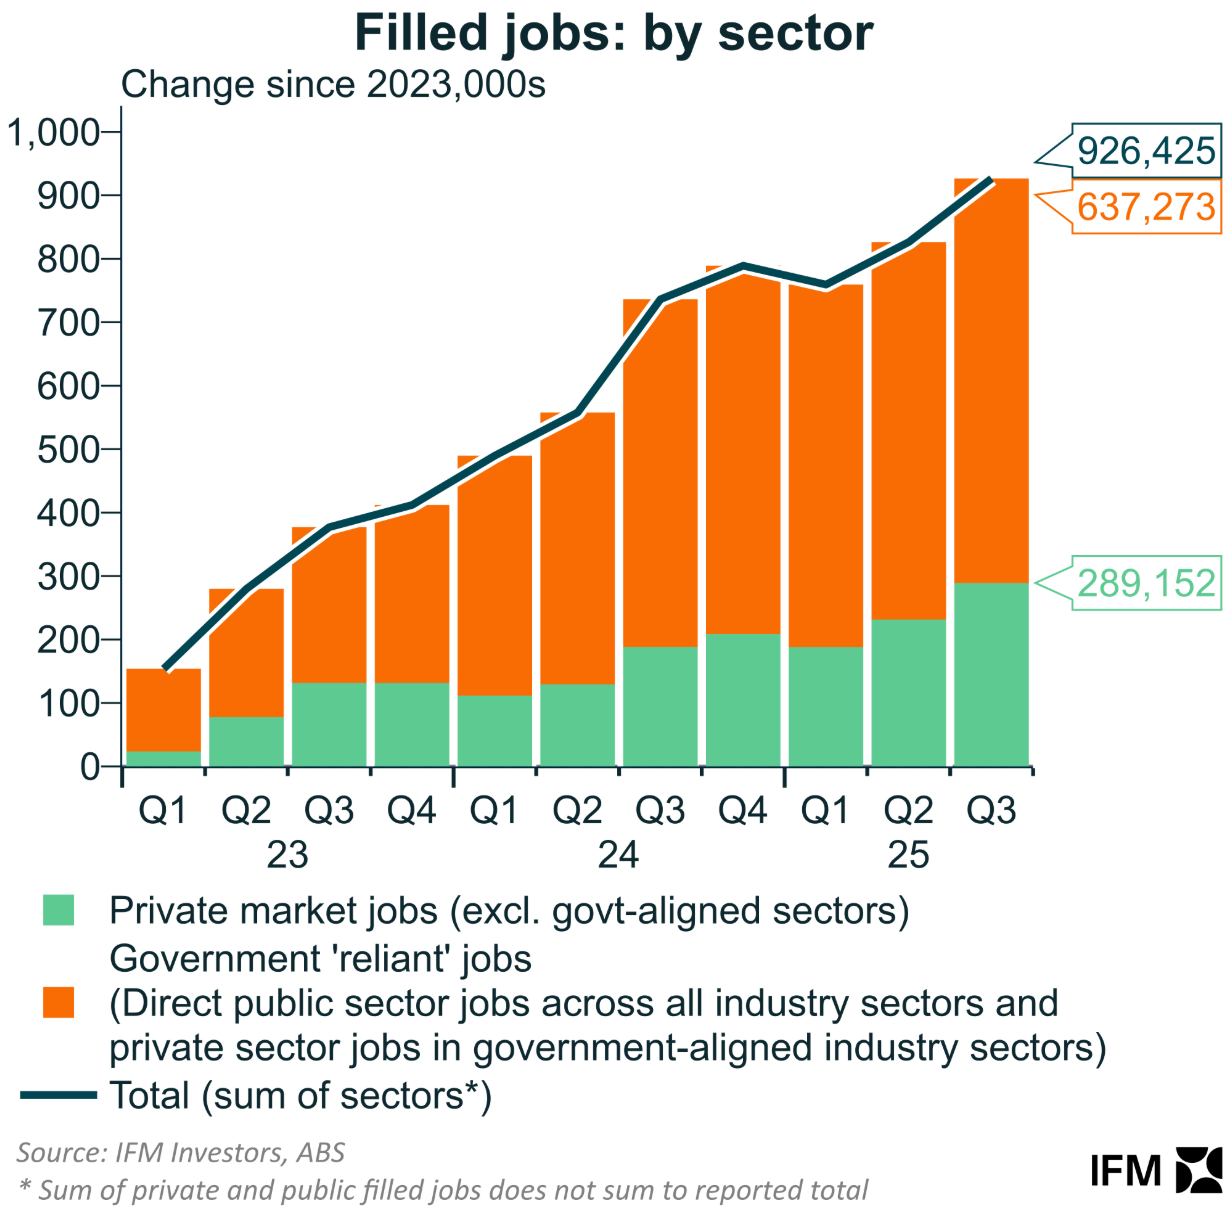
However, as Alex Joiner, chief economist at IFM Investors, shows below, of the 926,425 jobs created between Q1 2023 and Q3 2025, 637,273 (69%) were in the non-market sector, which is primarily government-funded.
On Wednesday, the Australian Bureau of Statistics (ABS) published wage price data for the December quarter of 2025, which showed that annual wage growth was strongest for the healthcare and social services industry (4.4%), followed by electricity, gas, water, and waste services (i.e., utilities), which grew by 4.2%:
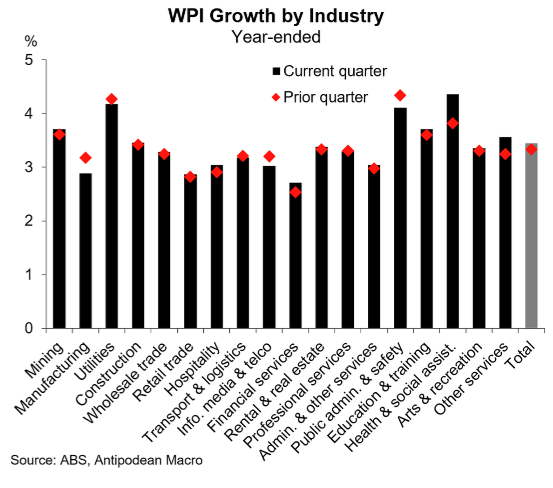
Chart by Justin Fabo from Antipodean Macro
The strong growth in wages in the healthcare and social services industry is well understood and is linked to the expansion of the NDIS and increased demand for aged care amid the ageing population.
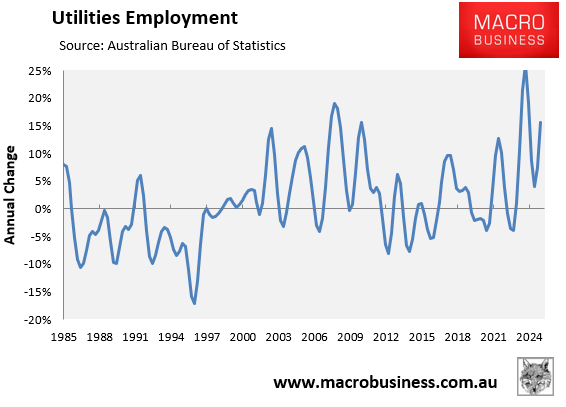
The surge in wage growth in utilities, shown as a time series below, is likely a reflection of the build-out of renewable energy infrastructure and generation, which is heavily subsidised or funded directly by the government.
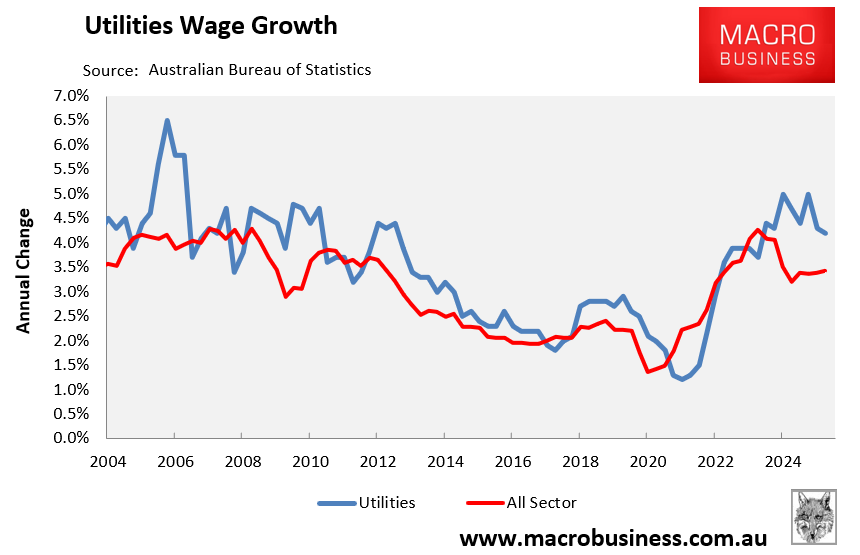
Not surprisingly, the utilities industry has experienced strong employment growth over recent years:
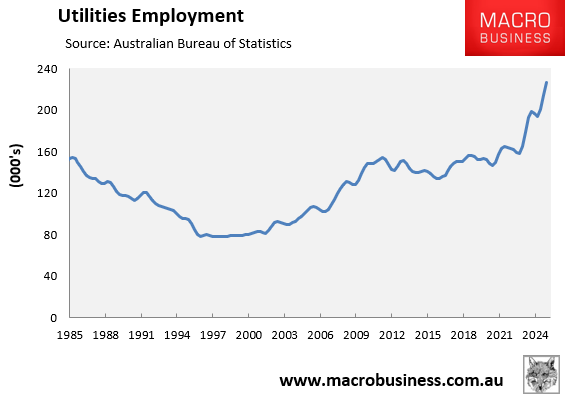
Since the August quarter of 2023, the number of people employed in the utilities industry has grown by 69,800, a 44% increase.
Interestingly, a similar employment boom occurred in the utilities industry in the mid- to late 2000s, when the electricity network was “gold‑plated”.
During this “gold‑plated” period, network businesses undertook very large capital expenditure programs under regulatory settings that effectively rewarded investment regardless of actual demand growth.